Machine Learning: Supervised Learning 2
In the previous post, I talked about Linear Regression which predicts continuous values. But In the real world most of the time we are classifying things to distinguish them from one another.
The next algorithm I am going to talk about is a classification algorithm.


where S is a sample of training examples p+ are the proportion of positive outcomes and p- are the proportion of negative outcomes.
As we go down a decision tree we expect the entropy to decrease as we move closer to a decision.
2. GAIN: Expected reduction in entropy due to partitioning S on attribute A.

Let's take an example.

If we want to check information gain on "Humidity", We check the positive and negative outcomes for High and normal which can be used to find their entropy "Sv" is a value in "Humidity" (modulus indicates the count of that values i.e. total number of records that contain that value) and "|S|" is the total number of records and we do summation for all the values of "Humidity".
The node with the greatest gain is chosen as the next node.
We also need t make sure that the tree is not too deep as it may lead to overfitting.
Implementation of Decision Tree using SciKitLearn.

The next algorithm I am going to talk about is a classification algorithm.
Naive Bayes
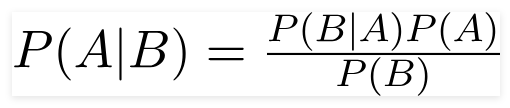
It is a really fast classification algorithm based on the Bayes theorem. It works on the Bayes Theorem of probability.
Bayes Theorem

We make two assumptions when we use this algorithm. One is that each feature is independent of each other and all predictors have an equal effect on the outcome.
What this algorithm does is it first converts the data into a frequency table and calculates the conditional probability for each event.
Final function that is used to give prediction is
Types of Naive Bayes Classifiers:
Multinomial Naive Bayes:
This is mostly used for document classification problem, i.e whether a document belongs to the category of sports, politics, technology, etc. The features/predictors used by the classifier are the frequency of the words present in the document.
Bernoulli Naive Bayes:
This is similar to the multinomial naive Bayes but the predictors are boolean variables. The parameters that we use to predict the class variable take up only values yes or no, for example, if a word occurs in the text or not.
Gaussian Naive Bayes:
When the predictors take up a continuous value and are not discrete, we assume that these values are sampled from a gaussian distribution.
Implementing Naive Bayes in SciKitLearn.
Implementing Naive Bayes in SciKitLearn.
Decision Tree Algorithm
A decision tree is a classification algorithm which forms a tree structure for decision making.

One the basis of the provided data it tries to form the smallest possible tree using which it can classify some data using its features. Each node in the tree checks for some criteria that the data can fulfill and proceeds accordingly to reach the leaf node where is given a certain classification.
There are two terms that we need to know which helps in the formation of Decision Trees:
1. ENTROPY: It can be defined as measured of uncertainty, purity, information content.
As we go down a decision tree we expect the entropy to decrease as we move closer to a decision.
2. GAIN: Expected reduction in entropy due to partitioning S on attribute A.
Let's take an example.

If we want to check information gain on "Humidity", We check the positive and negative outcomes for High and normal which can be used to find their entropy "Sv" is a value in "Humidity" (modulus indicates the count of that values i.e. total number of records that contain that value) and "|S|" is the total number of records and we do summation for all the values of "Humidity".
The node with the greatest gain is chosen as the next node.
We also need t make sure that the tree is not too deep as it may lead to overfitting.
Implementation of Decision Tree using SciKitLearn.
Logistic Regression
It is a classification that is based on the concept of Probability. It uses a cost function known as "Sigmoid" which returns values between 0 and 1.

It is a more complex form of Linear Regression with the prediction boundary between [0,1] i.e. probability of a class.
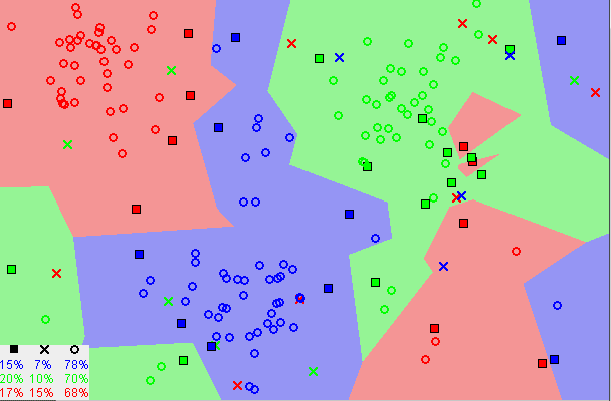
K-Nearest Neighbours
It is a very easy to implement algorithm that can be used for both classification and regression problems. It assumes that similar things exit closer to each other.
What K-NN does is it simply stores the entire dataset in a structure hence there is no learning involved. And most of the processing is done at the time of prediction. Moreover, it does not make any assumptions about the data.
For classification, it searches for K most similar instances (neighbors) and summaries the data on the basis of its neighbors. For finding the most similar instances it uses a distance measure. Euclidian Distance is the most popular among them. Others include Hamming, Manhattan, Minkowski Distance. You can learn about through a simple google search.
Euclidean is a good distance measure to use if the input variables are similar in type (e.g. all measured widths and heights). Manhattan distance is a good measure to use if the input variables are not similar in type (such as age, gender, height, etc.).
We have to tune the value of K to get the optimal results from the model. Larger value of K make the model more robust to noise but is bad on a small dataset, small values of K is recommended for a small dataset.
Moreover, it is recommended to use a lower dimension of the dataset as it becomes increasingly difficult for K-NN to do classification in Higher Dimension of data.
Dimensionality Reduction is quite important in machine learning. PCA (Principal Component Analysis) is a powerful technique used for dimentionality reduction. Thorugh it, we can directly decrease the number of feature variables, thereby narrowing the important features and saving on computations. It involves 3 steps:
1. Compute covariance matrix of the data.
2. Compute the eigen values and vectors of the covariance matrix.
3. Use the eigen values and vectors to select only the most important feature vectors and then transform your data onto those vectors for reduced dimensionality.
Using PCA in SciKitLearn.
Using PCA in SciKitLearn.


Comments
Post a Comment